
Data Visualization Services
Transform Data Into Clear, Actionable Stories
Unlock the power of your data through clarity and context
We help organizations make sense of complex data through impactful, interactive, and real-time dashboards that drive smarter decisions.
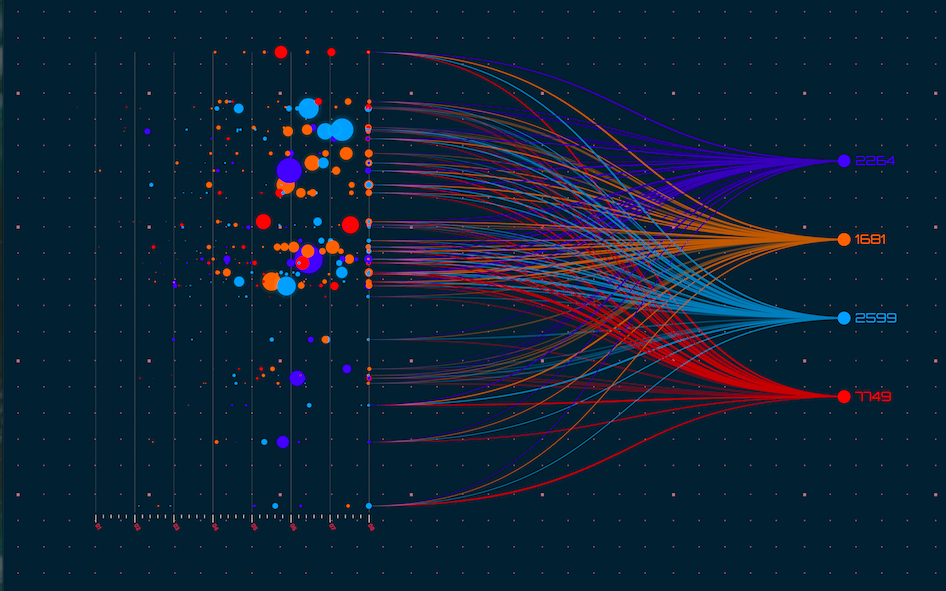
Our Data Visualization Services
Bringing your data to life with beautiful, interactive, and purposeful design.
Dashboard Design & Development
We craft visually engaging dashboards tailored to your unique KPIs, business goals, and user personas. From executive overviews to detailed operational reports, our dashboards deliver clarity and impact.
Real-Time Data Visualization
We build live dashboards using streaming data sources to help you monitor key metrics in real time. This enables fast, responsive decision making across operations, sales, customer support, and more.
Self Service Analytics Enablement
Empower your teams with intuitive, user-friendly BI tools that support ad-hoc exploration and report creation. We provide training and governance to ensure reliable insights without bottlenecks.
Embedded Analytics
We design and integrate analytics dashboards directly into your applications, intranet, customer portals, or SaaS products enhancing user experience and increasing platform value.
Storytelling with Data
We transform data into compelling visual narratives that support strategic decision making. Whether it’s an investor pitch, board presentation, or internal review, we help you tell the story behind the numbers.
KPI & Metrics Mapping
We work closely with your stakeholders to identify and structure the most critical performance indicators. Then, we visualize them using interactive charts, scorecards, and alerts for easy tracking and insights.
Why Exilon?
Experience, Expertise, and Excellence
We turn raw data into intuitive, actionable, and visually compelling experiences that empower everyone in your organization to make smarter, faster decisions.
At Exilon, we go beyond just creating charts and dashboards we design visual analytics ecosystems that drive real business value. Our approach blends deep technical expertise with a strong understanding of business needs to deliver data experiences that are both insightful and user friendly. Whether you’re looking to optimize executive reporting, enable self-service analytics, or embed insights into customer-facing platforms, our team ensures your data tells the right story to the right audience at the right time.

User Centric Design Approach
We build dashboards that are intuitive, interactive, and aligned with user needs.
Cloud Optimized Visual Layers
Scalable, high-performance dashboards across Azure, AWS, and Snowflake.
Cross Tool Expertise
From Tableau to Power BI, we use the right tool for your context.
Business Data Fit
We connect visuals directly to business outcomes, not just data points.
Let Your Data Speak Visually
From static reports to dynamic dashboards, we turn raw data into visual experiences that empower action.
FAQs
What is data visualization and why is it important?
+
Data visualization is the graphical representation of data using charts, graphs, and dashboards. It simplifies complex information, uncovers trends, and enables faster, data-driven decision-making across all business functions.
What data visualization tools does Exilon support?
+
Exilon works with leading tools like Power BI, Tableau, Looker, and custom D3.js or Python-based visualizations—tailored to your tech stack and business objectives for maximum impact.
How can Exilon improve my existing dashboards and reports?
+
We enhance your dashboards with clean layouts, real-time data integration, and interactive features. Our team optimizes performance and storytelling to ensure reports are insightful, actionable, and visually compelling.
Can Exilon create custom visualizations for my business data?
+
Absolutely. We design custom visualizations aligned with your KPIs, user roles, and decision-making workflows—whether it’s for executive summaries, operations, marketing, or product analytics.
Which industries benefit most from data visualization solutions?
+
All industries—from retail and healthcare to finance and logistics—leverage data visualization to monitor performance, detect patterns, improve forecasting, and make smarter decisions in real time.
HAVE A PROJECT IN MIND?
LET’S DISCUSS!
Let’s turn your project into reality—connect with us today
and explore
how we can help!